It’s been a whole six months since Liberation Day — the day the White House announced a wide sweep of global tariffs that sent the market into a panic. So where do things stand now? And who’s really paying for the tariffs? Our North America economist Marcos Carias dives right in.
It’s now been six months since “Liberation Day,” the day the White House announced a broad package of import duties — the largest U.S. tariff increase in nearly a century. It’s time to take stock of how the U.S. economy is digesting the tariffs implemented since.
In a nutshell:
- Tariff inflation has been more protracted than expected, but that doesn’t mean it’s not there, or not relevant.
- Beyond consumer inflation, U.S. importers are absorbing much of the cost, with some being transmitted to foreign exporters.
- The economy is behaving like it might be shifting from stagflation to reheating (if the labor market allows it).
Inflation: Beware the hype, focus on the data
Some commentators argue that there is no significant inflation from tariffs, but two things can be true at the same time:
- Tariff inflation has been tamer than initially expected, or certainly compared to what was feared during peak trade-war anxiety (April-May).
- We do, in fact, have clear and measurable tariff inflation.
First, let’s be mindful that it’s easy to let the expectations roller coaster distort our reading of reality, for example:
- White House announces huge tariffs -> experts sound the alarm -> public expects huge inflation tomorrow.
- White House backs down tariffs and they take time to kick in -> inflation comes in lower and slower than what the public got used to expecting -> “there’s no significant inflation from tariffs”
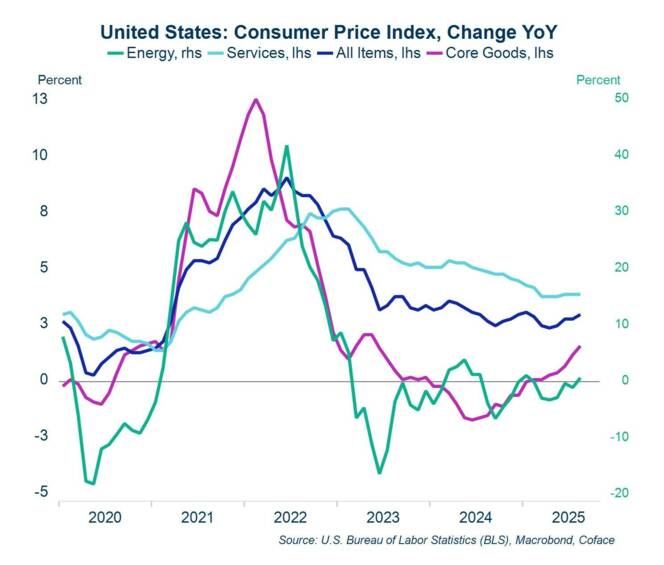
The fact is, however, that both core and headline inflation are stuck around the 3% mark. We’ve been above target for 55 months and counting. Saying, “inflation has been lower than expected” is not the same thing as “there’s no inflation.” Prolonged above-target inflation is how people eventually stop believing the Fed is serious about price stability.
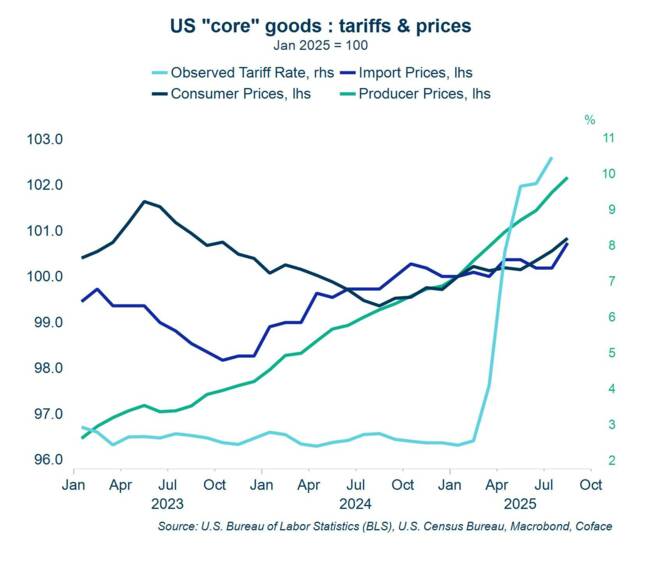
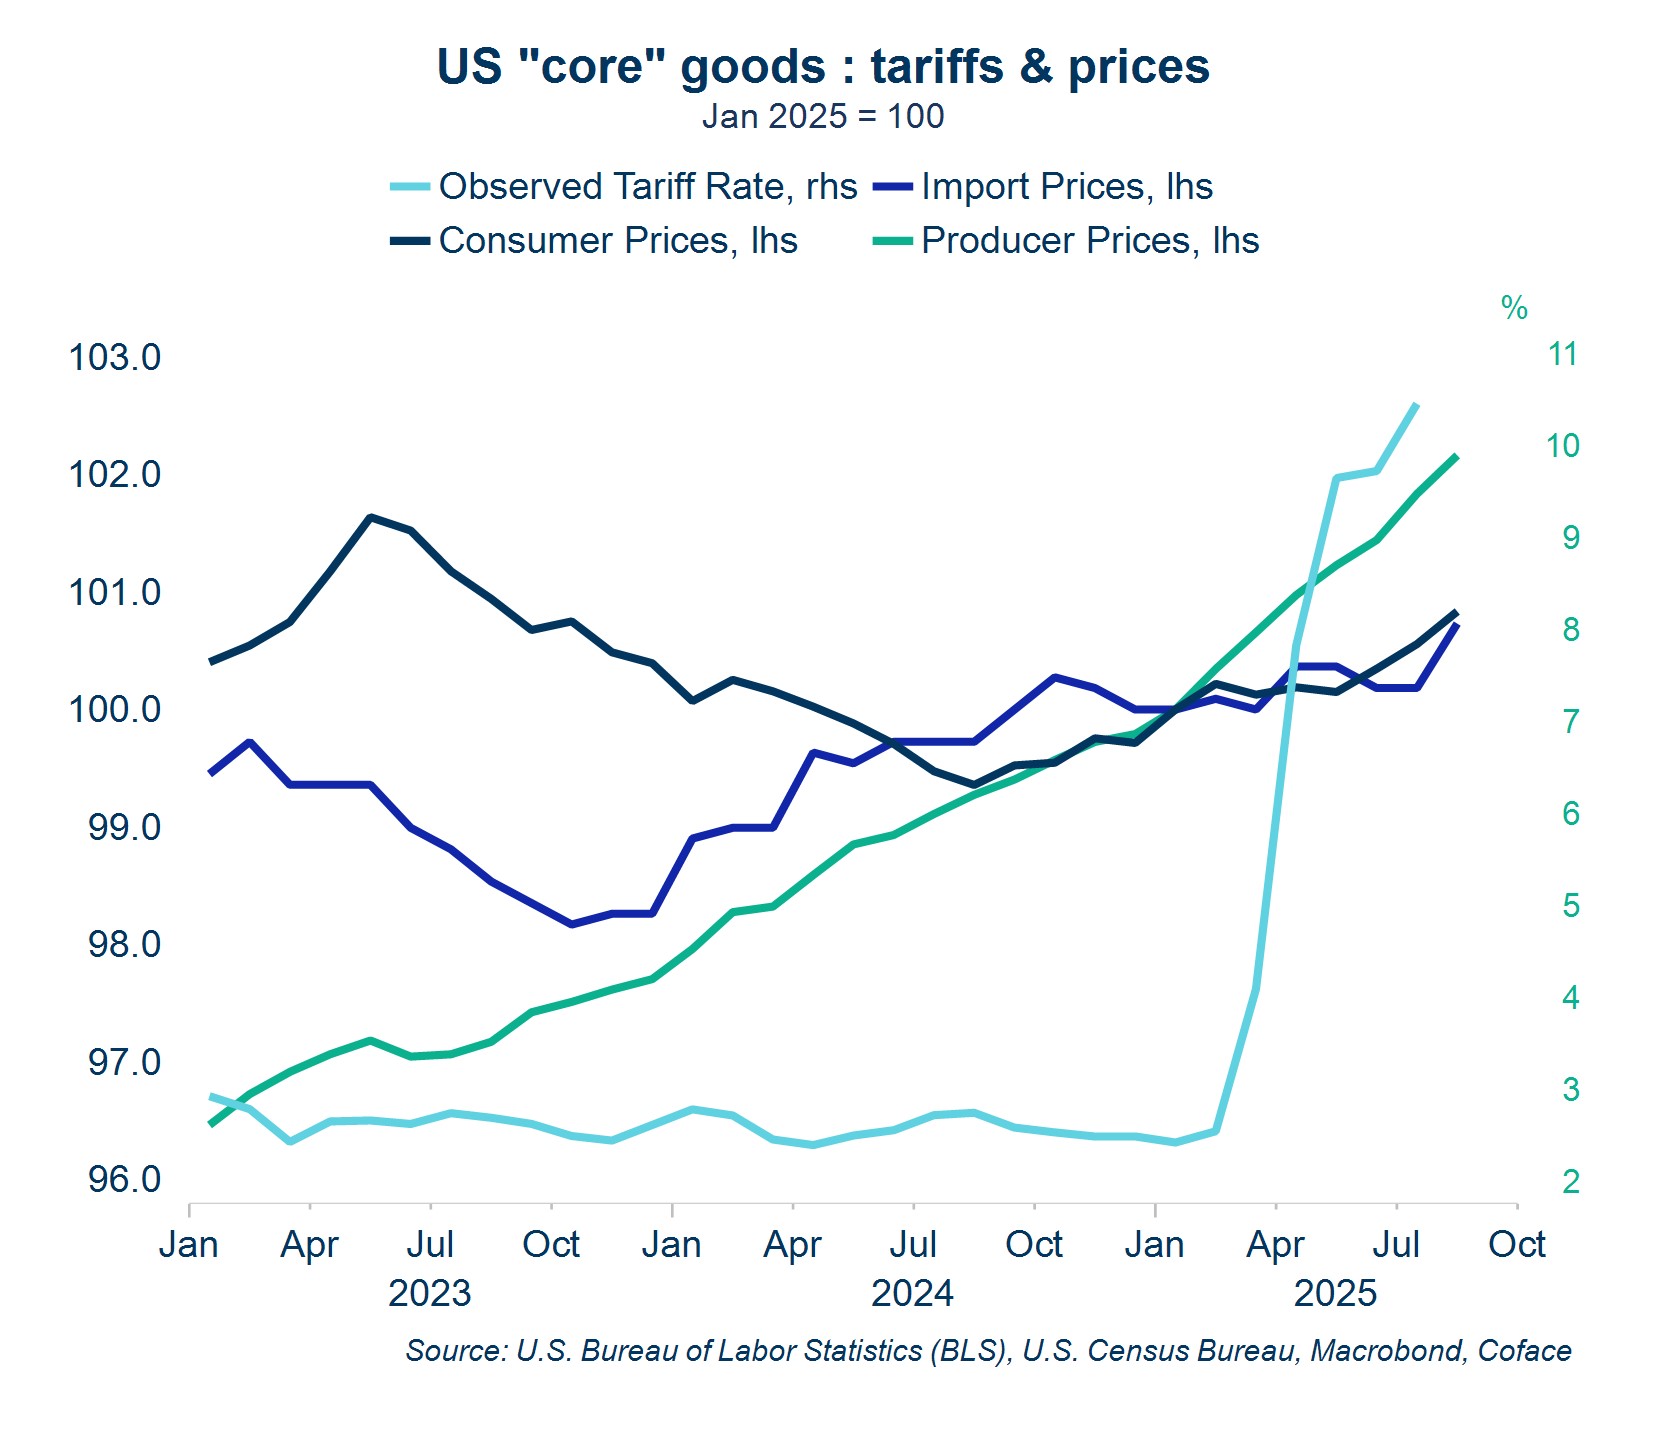
Second, if we’re looking for evidence of tariff inflation (or lack thereof), we shouldn’t be looking at headline inflation, or even core inflation, but core goods inflation. The consumer price index (CPI) is a big basket, and very large chunks of it (rent, haircuts, gas) have little to do with tariffs. Prices of goods net of energy and food are showing a discrete upturn in 2025 after having contributed to disinflation during pretty much all of 2024.

Bear in mind that due to tariff implementation lags, the buffering effects of inventory front-running, and the myriad of tariff mitigation strategies deployed by companies, the transmission process is unlikely to be done.
Beyond consumer inflation: Supply chain strain
To mitigate the impact of tariffs, U.S. importers have a range of options:
- They can increase selling prices, passing the cost down to other firms, and eventually to households. This should show up as an increase in consumer and/or producer prices (i.e. prices paid on goods sold to other firms)
- They can negotiate lower buying prices from foreign suppliers, which should result in lower import prices (note: import prices DO NOT include tariffs)
- They can “eat the tariff” by letting it erode unit margins — sometimes by choice, sometimes by necessity.
Tariff costs may very well be pushing some firms toward bankruptcy without a peep out of the CPI. So, if we want the full picture, monitoring consumer prices is not enough. Here are some examples:
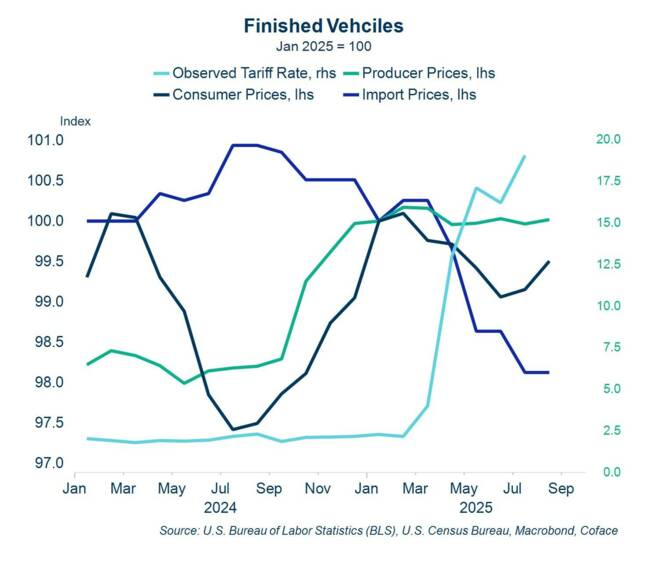
Automotive: Despite being subject to some of the toughest sets of tariffs, there are no signs yet of consumer inflation in the car market. Though exporters are taking some of the burden (2% decline since January), the full picture suggests that U.S. manufacturers are absorbing the lion’s share of the cost. GM attributed $1.1B in losses related to tariffs in Q2, and expects it to mount up to $4B to$5B by the end of the year. This is also consistent with recent high-profile bankruptcies in the industry’s ecosystem.
Download all graph data here.
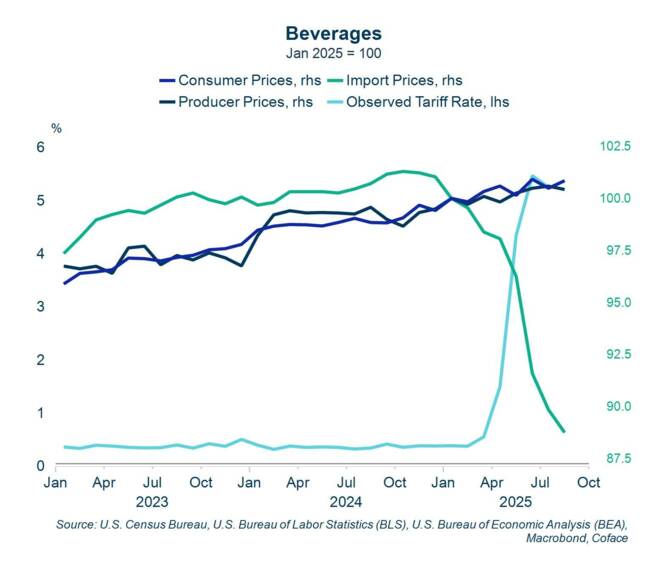
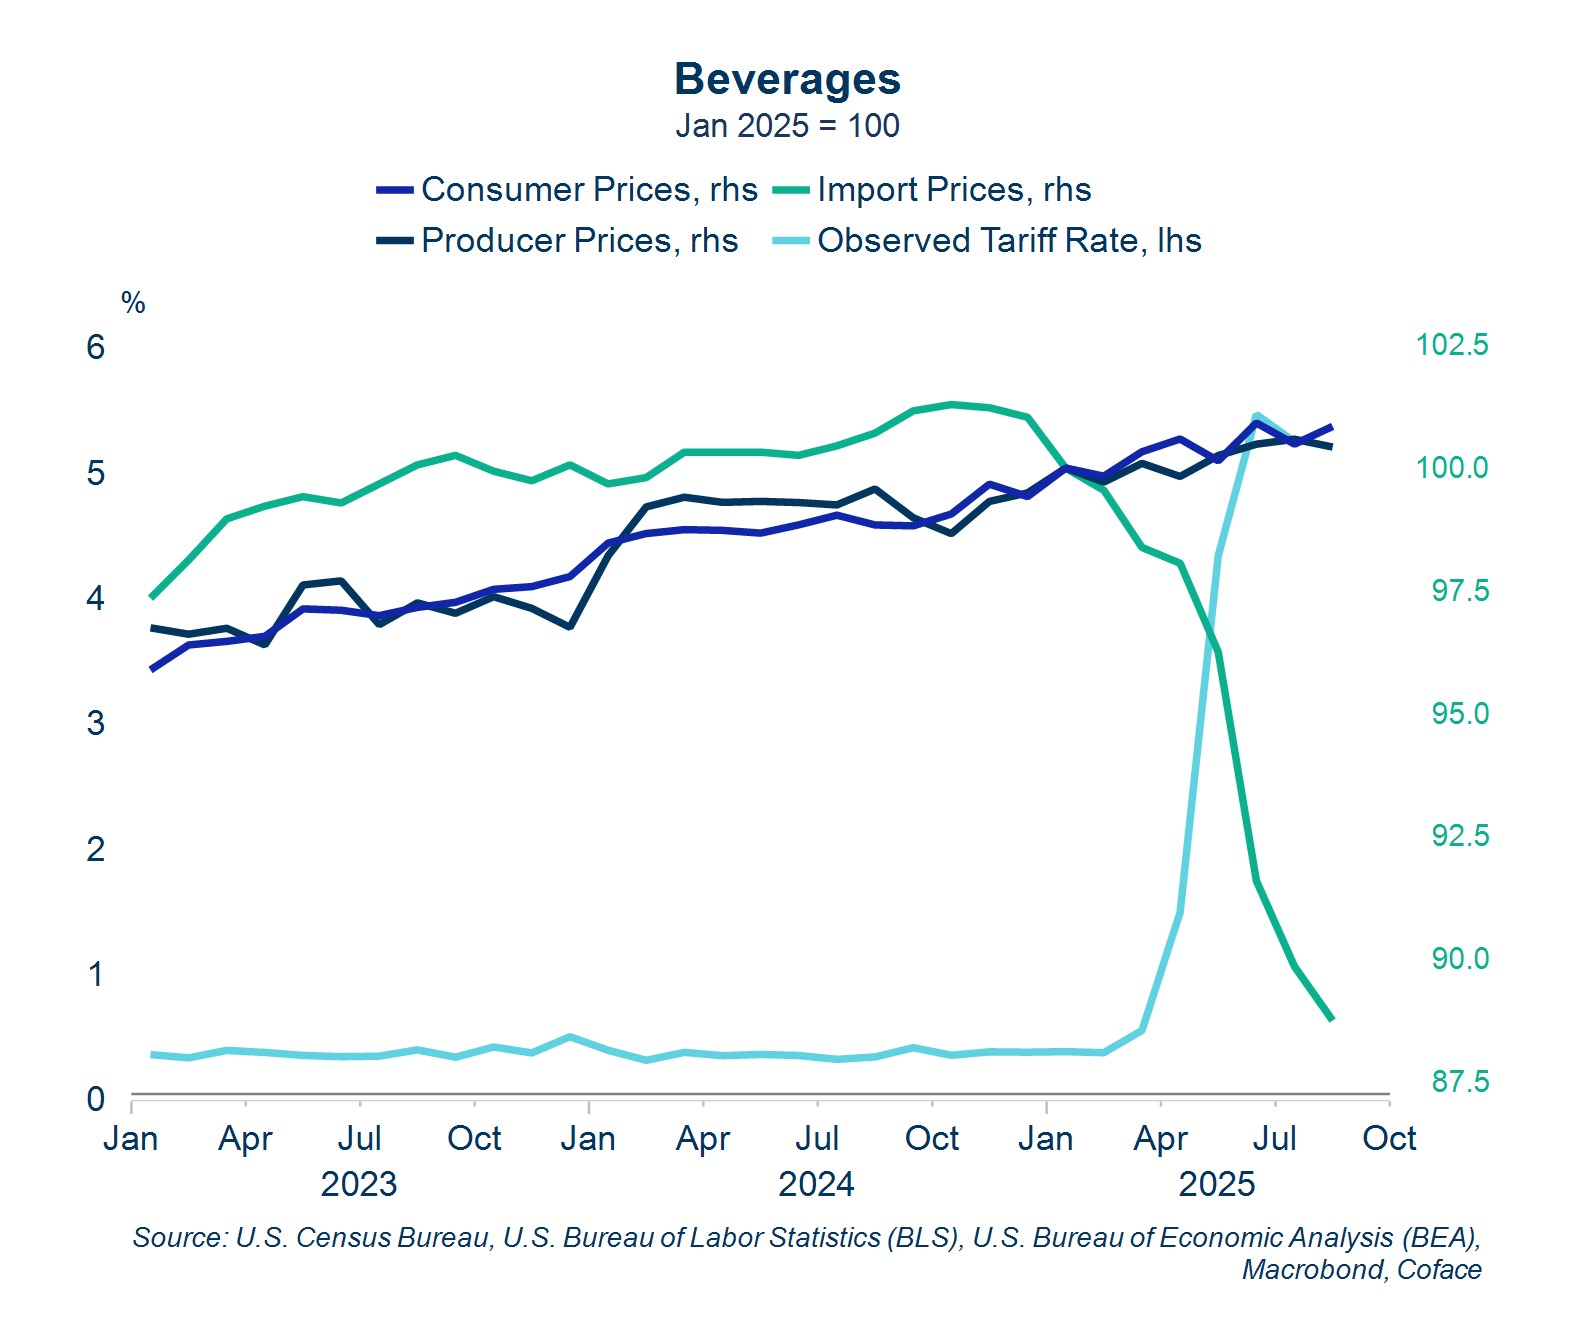
Beverages: The beverage industry appears as one of the few clear-cut cases of transmission to exporters, particularly for spirits, where import prices have declined 22% since March.
Aluminum: Tracking producer and import prices is especially important for aluminum, where we’ve had the most aggressive set of tariffs and the bulk of imports go to making other things (buildings, cans and cars).
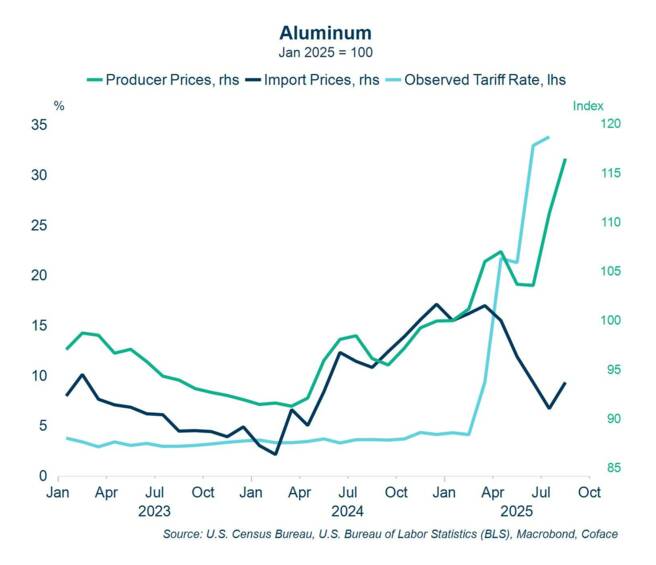
Before the latest round of tariffs kicked in, aluminum import prices and producer prices moved pretty much in tandem. This year, we’re seeing producer prices shoot up, and import prices drop. The U.S. depends on imports for roughly half of its aluminum supply, most of it from Canada. The 50% tariff has led to an acute contraction of imports, too fast for domestic supply to keep up, leading to a decoupling of the U.S. and global markets. This is resulting in windfall profits for the U.S. primary aluminum producers, who are getting a boost to their market power, but it creates cost pressure downstream in sectors like construction, aerospace, packaging, durable goods and machinery.
There’s hardly a “one-size-fits-all” profile for tariff transmission, but the macro data suggests most of the costs are being shared between U.S. firms and consumers, as decreases in import prices are the exception rather than the rule.
A whiff of reheating?
The demand side of the economy has been revealed to be more solid than we thought some months ago, with a major upward revision to Q2 consumption that makes the Q1 dip look more like a one off. We seem on track for a rather good Q3 as well, though there’s room to hit another air pocket in Q4 when tariff inflation is expected to be nearing its peak.
I’m tempted to suggest we’re shifting from a stagflation-lite regime (above-target inflation, low growth) to reheating (accelerating inflation and growth), but there’s one element that gives me pause: the labor market. If it keeps weakening, it will progressively start to bite into the incomes of middle-class and upper-middle class households and take some wind out of consumption growth.
Unfortunately, the recent government shutdown threatens to make it even trickier than usual to take the labor market’s temperature. The Bureau of Labor Statistics will be one of the many agencies ceasing operations, delaying the publication of the Oct. 3 job report and ceasing primary data collection for the duration of the shutdown. We’ll just have to hold our breath a little longer than usual before we get the next clue to the puzzle.
Marcos Carias is a Coface economist for the North America region. He has a PhD in Economics from the University of Bordeaux in France, and provides frequent country risk monitoring and macroeconomic forecasts for the U.S., Canada and Mexico. For more economic insights, follow Marcos on LinkedIn.
Interested in business protection and predictive insights? Contact our experts now.