If you feel like you are receiving mixed market signals, left and right, you aren’t alone. It would make the economic forecaster’s life so much easier to take the soft data’s word at face value and conclude that it’s all a matter of time before tariffs start bringing down core GDP. But is it really that simple?
Note from the author: While the tariff conversation is quickly changing, readers should note that the latest tariff threats on the EU do not fundamentally change the conclusions of this post.
Trying to forecast the U.S. economy in this moment feels awkward. The Q1 GDP print looks rather bad on surface (-0.3% annualized contraction, down from a solid 2.4% expansion in Q424), but when you zoom in, consumption and investment held up rather well (2.8% and 5.4%, respectively). That queasy headline print can be largely attributed to firms racing to stockpile inputs made abroad to get ahead of tariffs. Imports saw an astonishing 41.3% spike, the largest since 1972 (discounting the pandemic)1. The few readings of hard data we have for April (retail sales, inflation and labor market data) range from neutral to benign, but sentiment indicators (a.k.a. the soft data) remain, on balance, well in negative territory.
What should we make of this?
A proper recession would require a strong enough downturn in consumption and/or investment (a.k.a. “core” GDP), as import front-running should, in principle, offset itself throughout the year. Taken at face value, the quarterly figures for core GDP are not worse than what you might have expected in a world without tariffs. But here, again, we have a bit of a muddy picture.
If inflation expectation surveys are any indication, consumers are every bit as worried about tariffs as producers. As a result, economist suspect that consumers, too, are bringing at least some of their expenses forward. If this is occurring as suspected, it could be artificially boosting the actual underlying momentum and may create an air pocket in demand later in the year.
If you feel like you are receiving mixed signals, left and right, you aren’t alone. It would make the forecaster’s life so much easier to take the soft data’s word at face value and conclude that it’s all a matter of time before tariffs start bringing down core GDP. But is it really that simple?
Why we should worry about dips in sentiment
Sentiment indicators are different measurements that act as a barometer of sorts on the mood of the market. Are we being overly optimistic? Are we being overly pessimistic? What are the feelings in the market right now that may influence investment decisions?
Sentiment indicators are our best attempt to grab the opinion of economic agents on a given topic at a specific point in time and crystallize it as a clean, interpretable number. Here’s how they work:
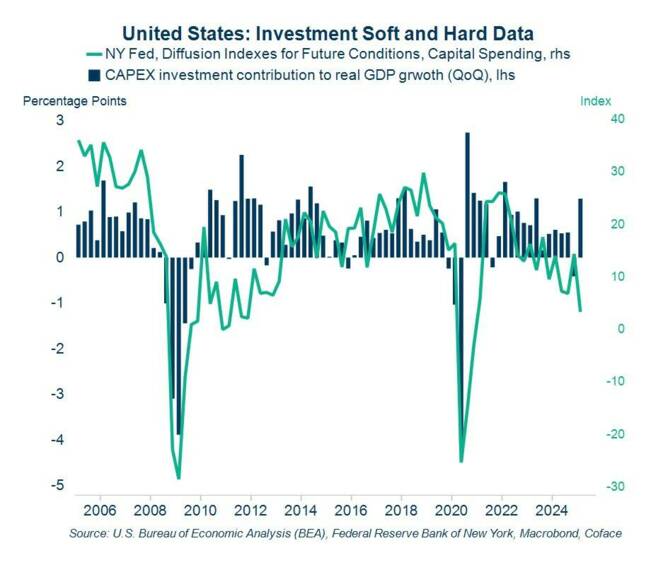
The survey-taker (the Fed, U-Michigan and the Conference Board in our examples below) sends a questionnaire to a sample of respondents, asking, for instance, if their hiring intentions are increasing or decreasing. Those answers get aggregated, and the number we get at the end (called a “diffusion index”) is typically some version of the net share of respondents signaling improvement/worsening of conditions. A sharp dip indicates an unusually large share of respondents shifting bullish to bearish. Now that you understand the concept, you might wondering, what can sentiment indicators tell us? To answer this, let’s look at the number for future capital spending conditions from the NY Fed’s business leader’s survey (Chart 1).
In this graph, we definitely get a clear signal of key moments in the global financial crisis and even the pandemic. We also get a sense that a somewhat pessimistic bias can linger in the years following these shocks.
Chart 1
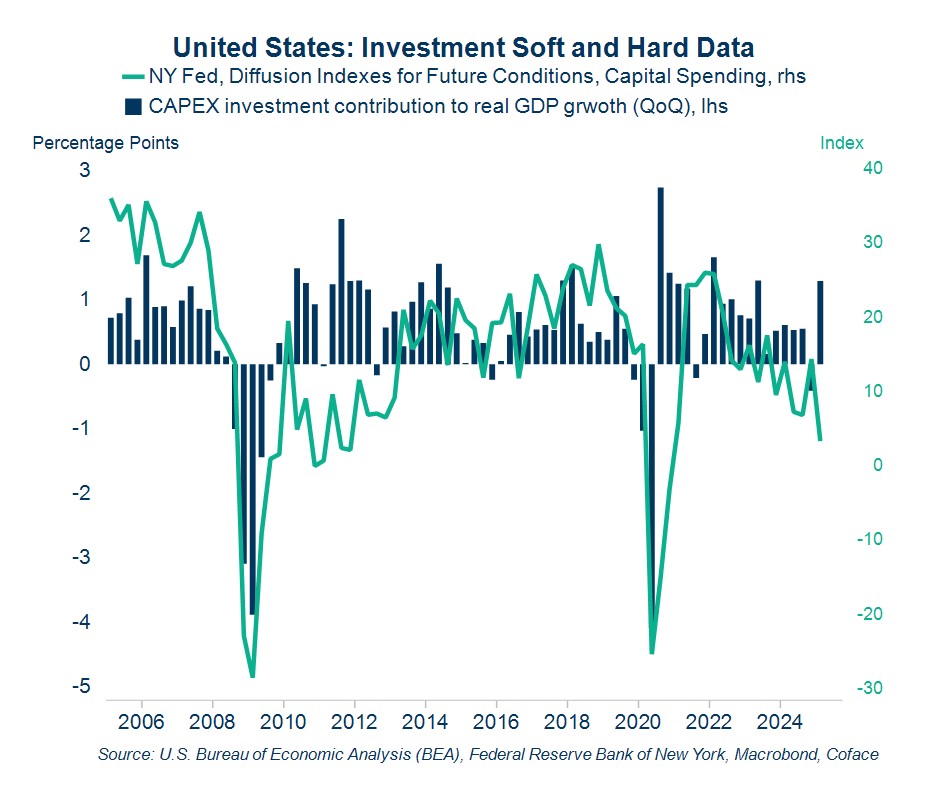
Understanding consumer confidence is a little more complicated. Looking at the two most-followed consumer sentiment indicators (U-Michigan’s and the Conference Board’s), we’ve seen some pretty clear and early signals in the run up to major economic moments like the dotcom bust in 2001 and the global recession of 2008.
In the former, there is a clear dip in sentiment in September and November of 2000, followed by a slowdown and then a recession that bottomed out in April 2021 (Chart 2). Similarly in the 2008 recession, sentiment started dipping during the summer of 2007, giving a clear warning of the coming contraction the following year (Chart 3).
Chart 2

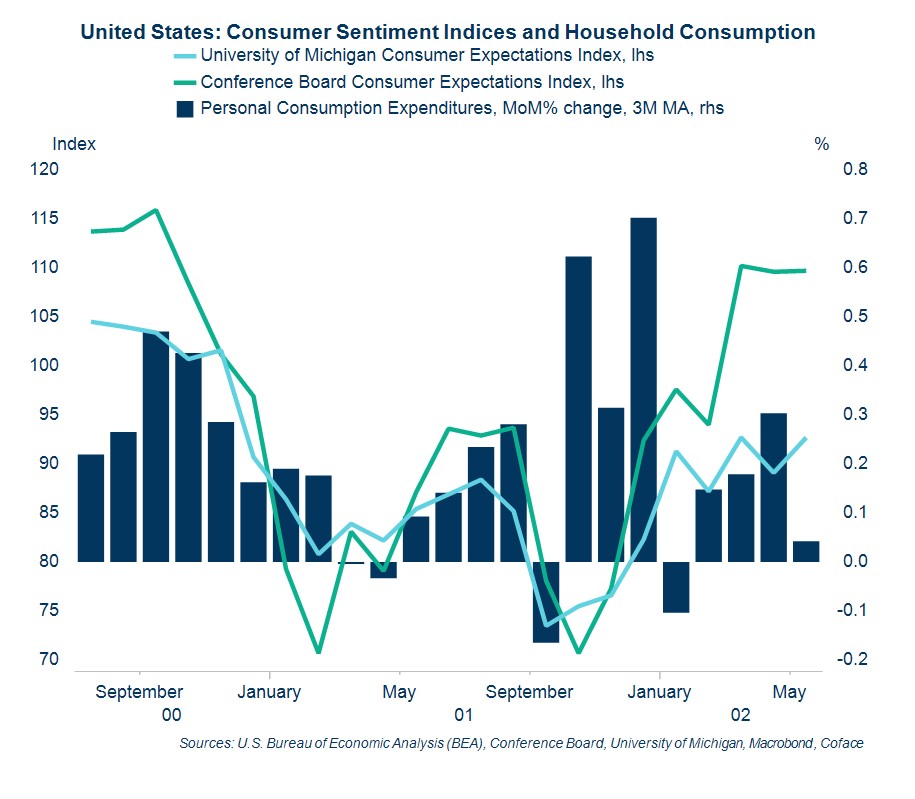
Chart 3

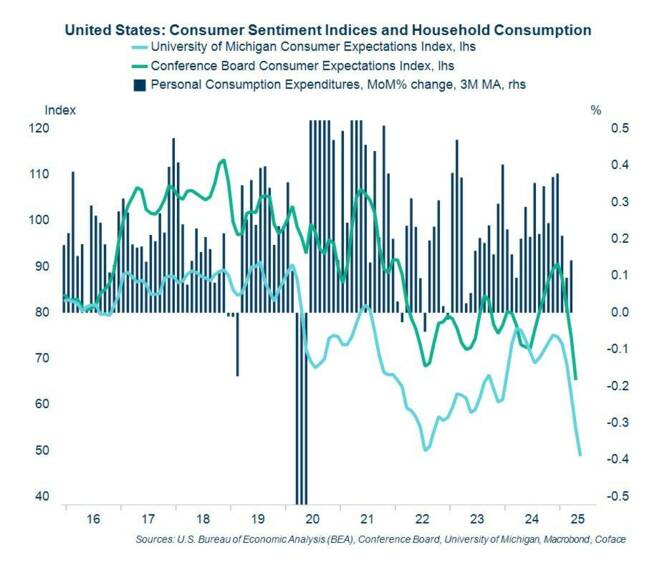
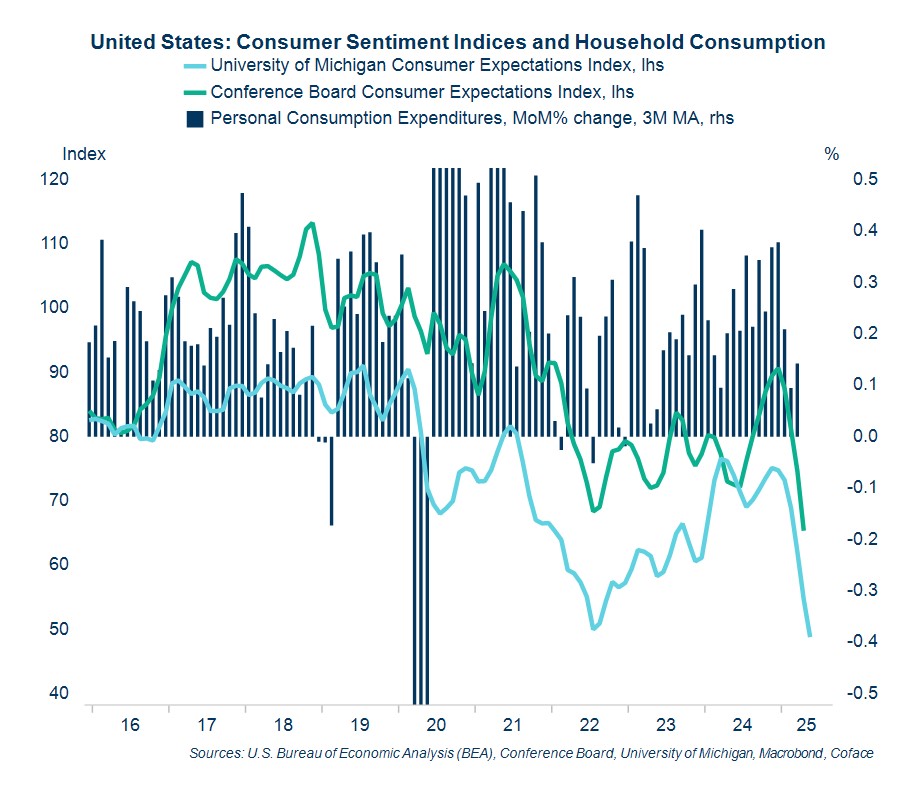
Consumer confidence isn’t a perfect science, though, and we can also pick out some noisy signals that didn’t actually pan out into anything. Instances where the indicators arguably “cried wolf,” so to speak, occurred in the the summer of 2011 (Chart 4) and 2021-2022 (Chart 5).
Chart 4

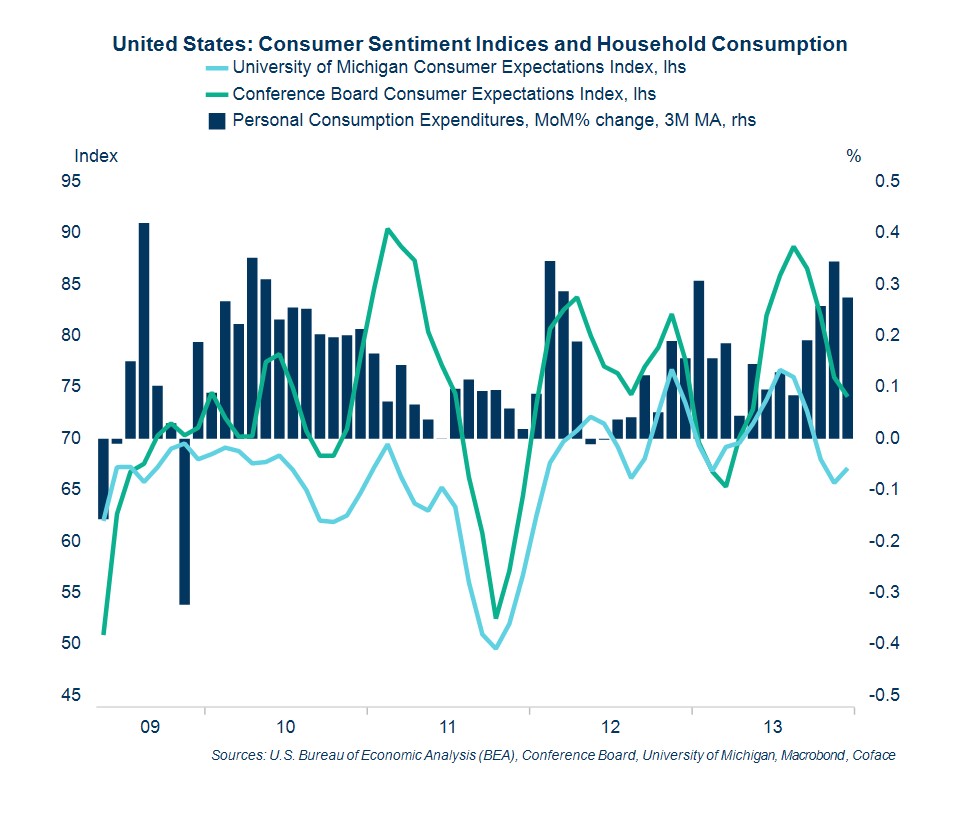
Chart 5
Take sentiment with a pinch of salt
Sentiment data is heavily valued for its timeliness, but it is ultimately based on what people say and perceive, as opposed to what they actually do. That’s not to say this is completely void, but you have to be careful of how much you read into someone’s words. Or, to quote your mother, “actions speak louder than words.”
In recent years, one well-known bias that has become increasingly salient is partisan polarization. Simply put, both conservatives and liberals are systematically more pessimistic about the economy when the rival team is in the oval office, regardless of how the economy is actually performing.
We know this because the University of Michigan publishes the results of its survey split by political affiliation, and the curves speak for themselves. I see little reason to think you don’t have similar biases in the samples for other surveys, even if they might not be as stark. This creates a double-sided risk of misreading when the origin of the shock comes with such partisan baggage: a risk of excess pessimism on the left, and an overly sanguine predisposition on the right.
Another sign of the difference between words and actions can be seen in the consumer’s experience of living standards and our material measures of it. You’ll notice that consumer confidence is durably lower in the post-pandemic period vs 2015-2019 time frame even after wage growth started catching up to inflation in 2023-2024.
Part of this is due to inequality, with lower income households disproportionately exposed to inflation; but it wasn’t just real (i.e. inflation-adjusted) average wages that rose, it was real median wages (3.5% higher in 2024 vs 2019). My best guess is that people would much rather have a 2% raise at 2% inflation than a 6% raise at 6% inflation, even if they’re equivalent in terms of real purchasing power. A raise is the fruit of your hard work, inflation is impoverishment out of thin air.
Beyond these subjective considerations, inflation imposes a real cognitive cost on economic agents: it makes it harder to judge what a fair price is for something (including one’s labor), or to guess what things will cost in the future. However, we might sympathize with these feelings, you want to discount them if what you want to use sentiment data for macro forecasting: however unpleasant and unpopular, the post-pandemic economy was one of soaring consumption.
The sentiment verdict
Despite my growing concerns about sounding like a broken record, it seems like this is yet another indicator that is just too early to call. We can’t write off these sentiment dips as a false alarms but we should have a healthy dose of skepticism.
Sentiment data is still useful, though not infallible. Use this data to listen to how people feel right now but don’t give it the last word.
The peak of the tariff shock hit in April, and one of the things you’d expect from all the inventory buildup is that it delays its transmission. If the hard data continues to hold up this well into the summer, we might want to start wondering if the supply chain is absorbing the shock before it reaches the consumer (i.e., that businesses are eating the tariffs).
While this would be a welcome surprise for the consumer… not so much for firms with weak market power and therefore for the ambient level of corporate credit risk. There also might be other things we’re missing or have fallen out of the conversation of late (remember all those conversations about the benefits of AI productivity gains?).
At the moment, we must continue to operate in an if/then scenario where we keep our ears alert and eyes open to any signal. And then we claim we knew it all along.
Marcos Carias is a Coface economist for the North America region. He has a PhD in Economics from the University of Bordeaux in France, and provides frequent country risk monitoring and macroeconomic forecasts for the U.S., Canada and Mexico. For more economic insights, follow Marcos on LinkedIn.
Interested in business protection and predictive insights? Contact our experts now.
[1] Important: it’s not that import growth reduces GDP growth, it’s that it has to be discounted from GDP to get an accurate measure. The point of GDP is to measure the total amount of wealth produced in the country. A purchase of, say, an imported toy will increase domestic consumption or inventories; but we should not infer from that an increase in US toy production, hence the correction. Imports don’t subtract from GDP, they just don’t to add to it.
Download all graph data here.